IntelliDrive® 365: Redesigning a Telematics Program from the Inside out
Redesigning a continuous telematics program end-to-end — from app UX to go-to-market creative system — to earn customer trust at every touchpoint.
Role: Experience Design Lead (Core Team Lead)
Disciplines: Experience Design, Content strategy, Product Marketing, Experience Management
Timeline: 2023 - Ongoing
Status: Pilot Launched November 2024; national rollout in progress
Background
IntelliDrive 365 is Travelers Insurance’s continuous telematics program, built to help customers become safer drivers and save money doing it. Unlike its predecessor — a 90-day monitoring program — IntelliDrive 365 runs for the full six-month policy term, tracks all drivers on a policy, and removes scoring factors that customers had consistently flagged as unfair.
This case study covers the work our cross-functional Marketing & Experiences team did to bring it to life: from untangling a complex system of impacted touchpoints, to redesigning the app experience from the ground up, to building a full go-to-market creative system, all in service of a single guiding vision: a program customers trust with their family’s driving date.
The Problem
By 2024, IntelliDrive had been in market for 15 years across 4 iterations. The product team had strong data and a clear product direction for a new continuous program. But two challenges stood squarely in the way of a successful launch.
The business challenge: The competitive landscape was shifting. Usage-based insurance had become a meaningful differentiator — research showed that 41% of auto insurance shoppers consider UBI either very important or somewhat important when choosing a carrier. Travelers needed a 365-day view of driving behavior, not a 90-day snapshot, to remain competitive and hit its telematics capture goals.
The experience challenge: The existing program had real friction. Voice of Customer research had surfaced a consistent pattern of frustration: customers were being flagged for driving during commuting hours as a “risky” behavior, despite having no choice; distraction scores didn’t account for passengers using phones; and the performance guage was inaccessible to colorblind users, used slider indicators with no clear affordance, and left customers without a clear understanding of how their score connected to their premium.
The ask wasn’t just to design a new app. It was to distinguish a new continuous program from a well-known 90-day one — without abandoning the brand equity IntelliDrive had built — and do it across every system that touched the customer.
The Team
The core team was drawn from across the Marketing & Experiences chapter at Travelers PI, with representatives from Experience Design, Content Strategy, Product Marketing, and Experience Management serving as leads. Chapter subject matter experts contributed research, accessibility review, and experience management. We worked alongside a Product team of analysts, neighbor partners from Self-Service and Onboarding experience design, and legal counsel throughout.
The Experience Design lead served as Core Team Lead, responsible for coordinating across all workstreams and holding the creative and design direction across every touchpoint.
Listening First
Before any design work began, we grounded ourselves in what customers were actually saying. The Voice of Customer research painted a clear picture of where the existing program was falling short.
Customers felt the scoring was opaque and at times unfair. They wanted to understand exactly howe each behavior connected to their premium. They were motivated by savings — but the app wasn’t giving them the feedback loop they needed ot feel like their effort was paying off. And for users with color deficiencies, the rainbow-spectrum gaguge was effectively unreadable.
These weren’t edge cases. They were patterns. And they became the brief.
“I feel like the technology, specifically the performance tab, was inaccurate. It kept saying my “high speed” was “good” even though I only got flagged for “high speed” a handful of times. I went weeks without speeding and yet my score did not improve. Very discouraging.”
“I understand that people are more likely to get into accidents during rush hour, but most people work normal business hours so getting flagged for “time of the day” when you go to and leave work is kind of ridiculous.”
“No box to check off when passenger uses your phone, and you get flagged for distraction.””
Grounded in Evidence: The Research that Shaped the Design
The design decisions in IntelliDrive 365 weren’t made in a vacuum — they were validated through a series of unmoderated usability studies conducted in late 2023 and early 2024, testing everything from iconography to copy to visual design direction.
On the performance gauge, research confirmed what accessigility audits had flagged: the rainbow-spectrum gradient created real comprehension problems, particularly for colorblind users. A simplified monochromatic arc — one that matched familiar mental models like a fuel gauge — consistently outperformed the existing design on clarity, relevance, and visual appeal.
For the scoring variables, participants strongly preferred progress bars over the slider-based current state, citing the ability to understand their standing “at a glance.” However, despite user enthusiasm for color coding in testing, accessibility standards ultimately drove the design in a different direction. The final solution used clearly labeled progress bars with categorical ratings, ensuring the experience worked for all users without relying on color alone to communicate meaning. The existing design’s mixed metaphors — solid bars paired with a status notch indicator — performed worst across every visual preference test.
Copy testing surfaced a clear tension: customers preferred the familiar performance labels (Excellent, Great, Good, Needs Improvement) but responded significantly better to more descriptive sub-text that connected their score to real premium impact. The solution was additive — keep the recognized labels, enrich them with plain-language context. Research also informed the decision to move away from “Poor” as a label, despite its functional accuracy; 18% of participants called it judgmental and unmotivating, reinforcing the case for “Needs Improvement.”
What We Were Solving For
The work organized around four distinct problem areas:
Transparency and clarity. Language across the app and communications needed a full audit. Email cadences needed to be restructured. The onboarding flow needed clearer instructions to improve install rates — a metric directly tied to program success.
Education. Customers needed better access to scoring information, clearer communication about the new trip correction requirements that came with the continuous program, and the ability for the named insured to see score breakdowns across all drivers on the policy
Accessibility. The performance gauge, slider bars, score indicators, and iconography all needed to be evaluated and reworked for accessibility — not just for compliance, but to make the experience genuinely more intuitive for everyone.
System accuracy. The backend scoring needed to reflect what customers already knew; that driving during commuting hours shouldn’t carry the same penalty as genuinely risky behavior, and that a passenger using their phone isn’t driver distraction.
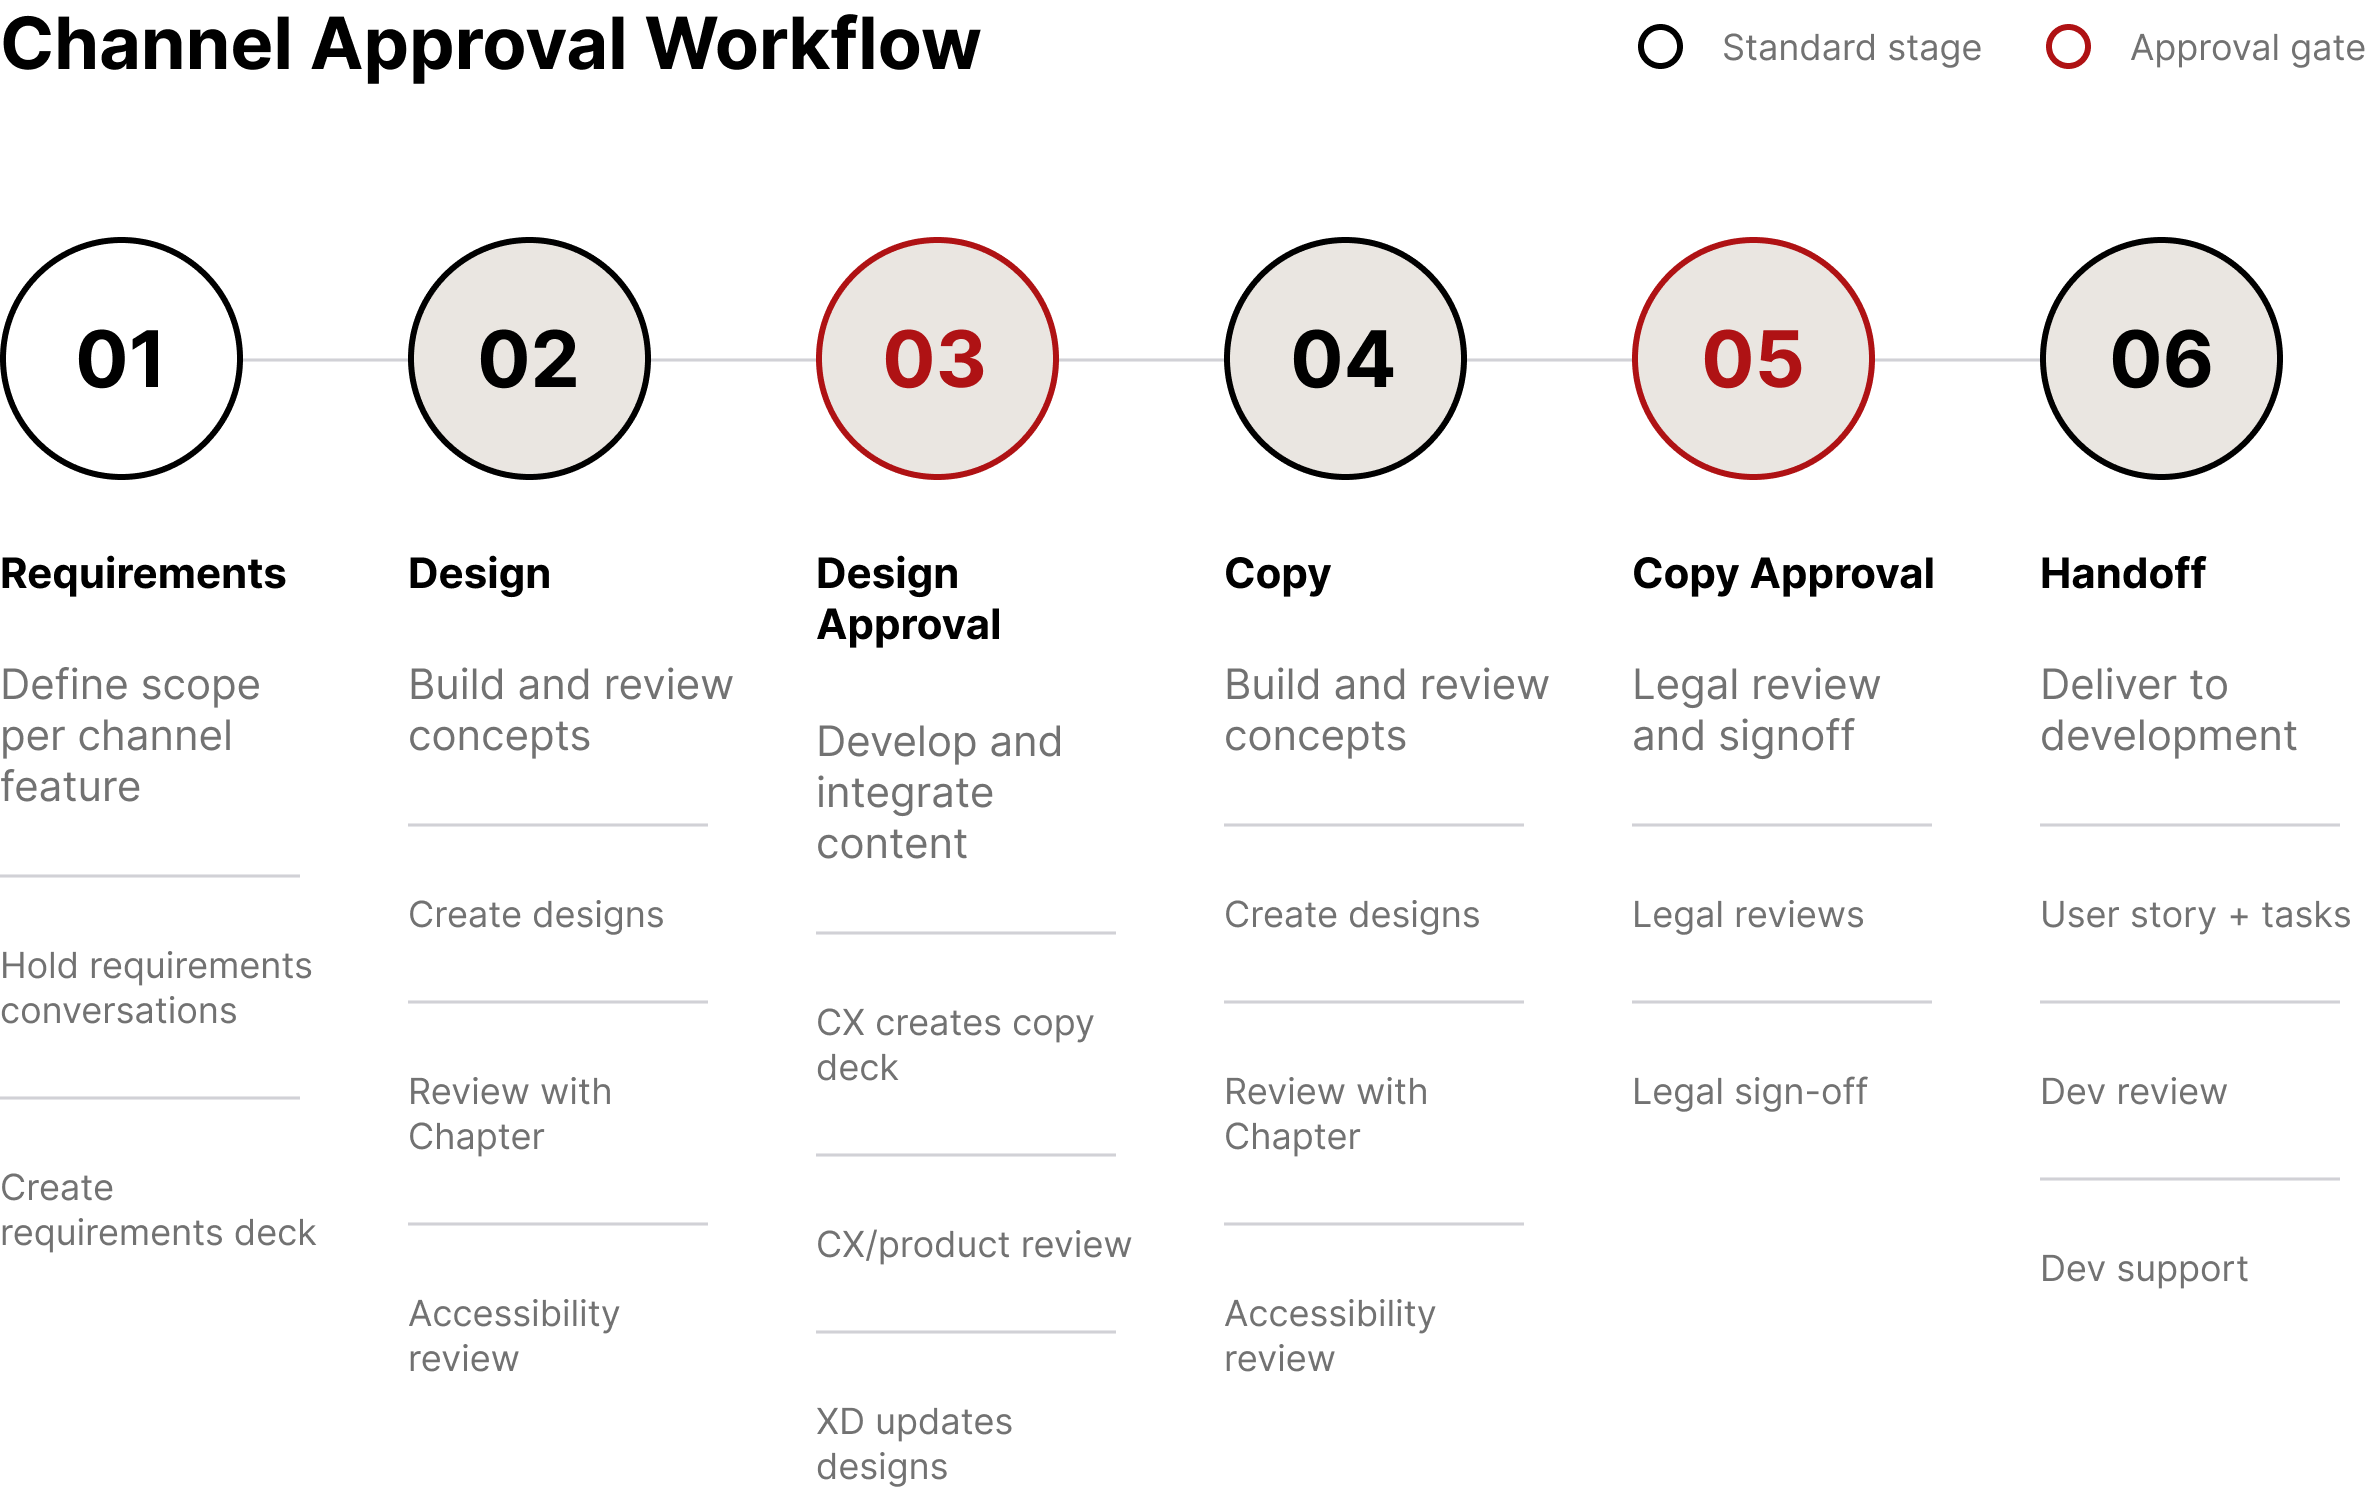
Our Process
We operated in two-week sprints with a clear six-stage workflow for every channel and feature: requirements, design, design approval, copy, copy approval, and handoff. Each stage involved the right stakeholders — product, accessibility, legal, leadership approval — before anything moved forward. IT was a process built to absorb complexity without losing speed.
Running alongside that sprint rhythm was a broader four-phase framework we called #ThinkCustomer:
Listening and understanding — ongoing VoC synthesis to understand where we were failing customers and what they needed.
Project Runway — defining what we were building and why, grounded in customer needs rather than feature lists.
Solution Design — building the right thing right, with usability testing, accessibility review, and cross-functional design approval at every stage.
Launch Monitoring — tracking whether what we built was actually working once it was in market.
This wasn’t a linear process. We were in multiple phases simultaneously across different parts of the system.
The Design Work
A New Brand Identity that Draws Parity Without Confusion
The first creative challenge was one of hierarchy. “IntelliDrive” is the program. The two apps — the existing ID2 app and the new ID365 app — needed to feel clearly distinct while still belonging to the same family. We resolved this through a deliberate visual system: a shared program-level identity for IntelliDrive, with differentiated app icons and graphic treatments for each version. The new ID365 app icon introduced a lighter, more open visual language — elevated red on a sky-blue ground — compared to the bold red-on red of the original.
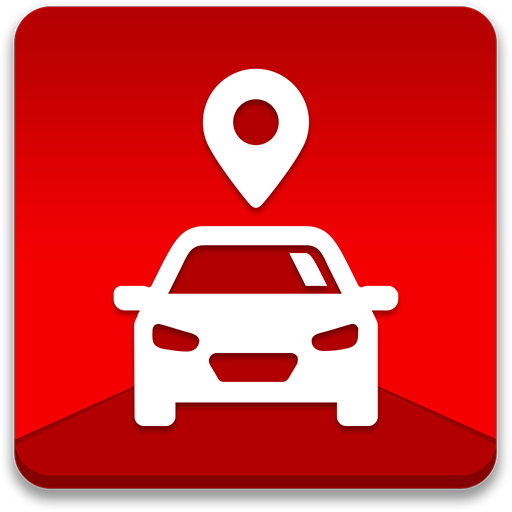
Original IntelliDrive icon
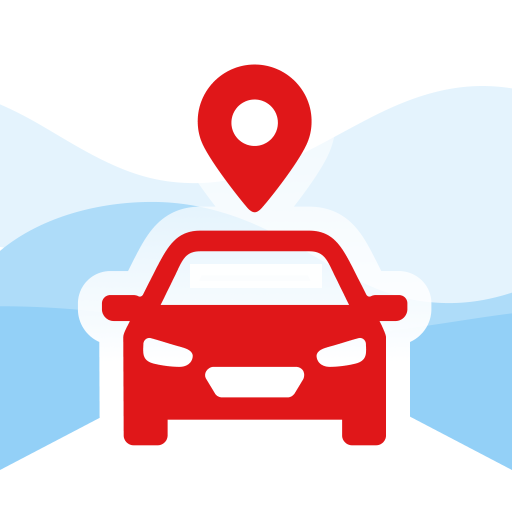
IntelliDrive 365 icon
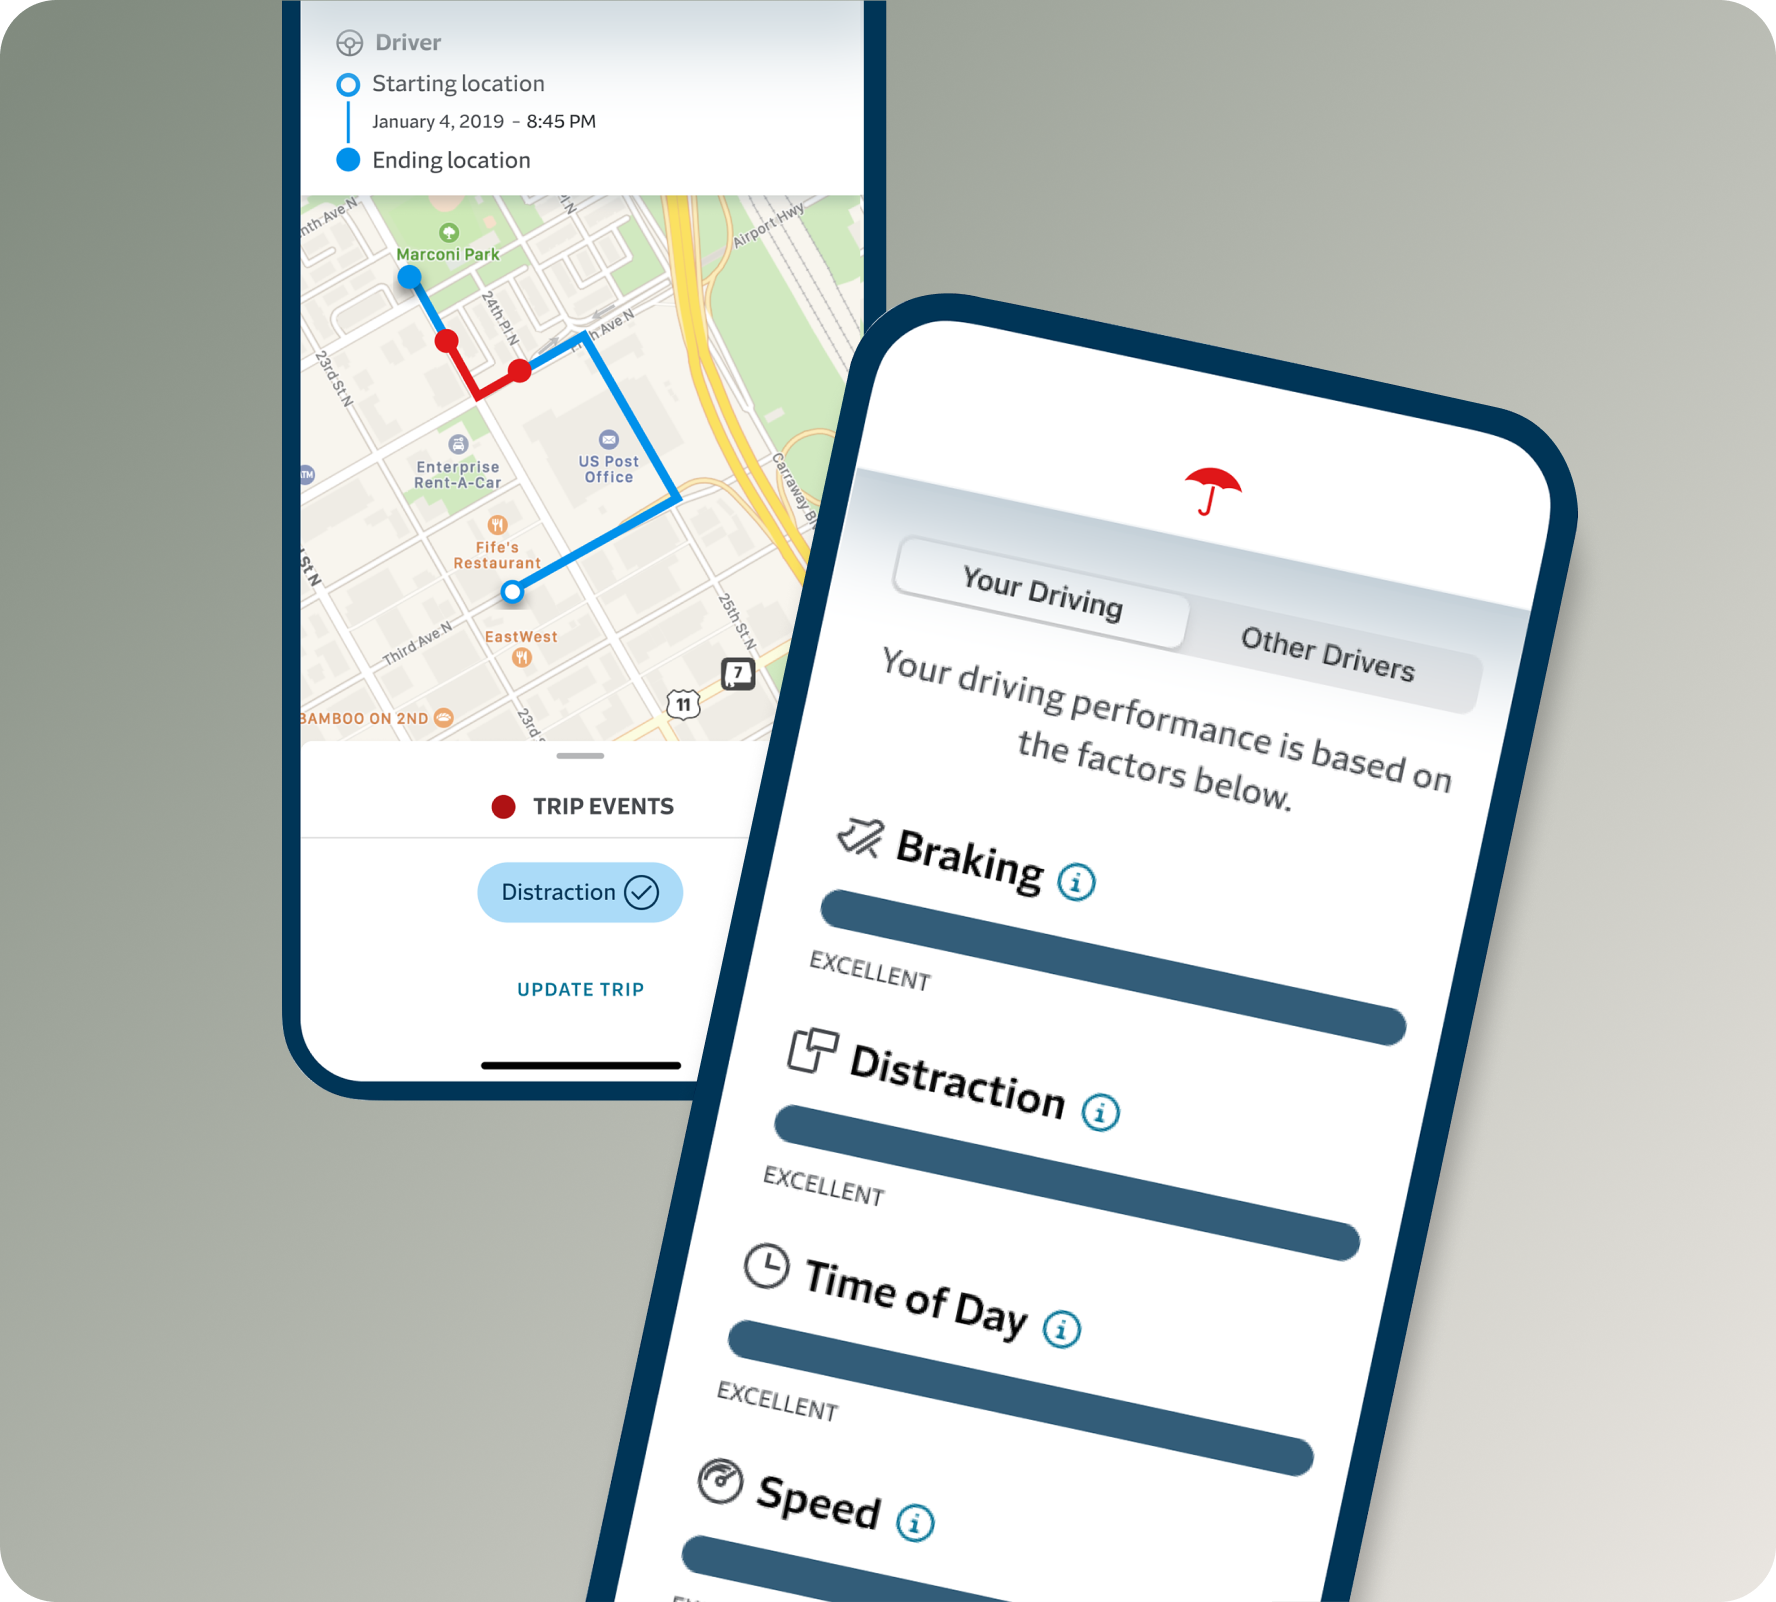
An All-New Dashboard
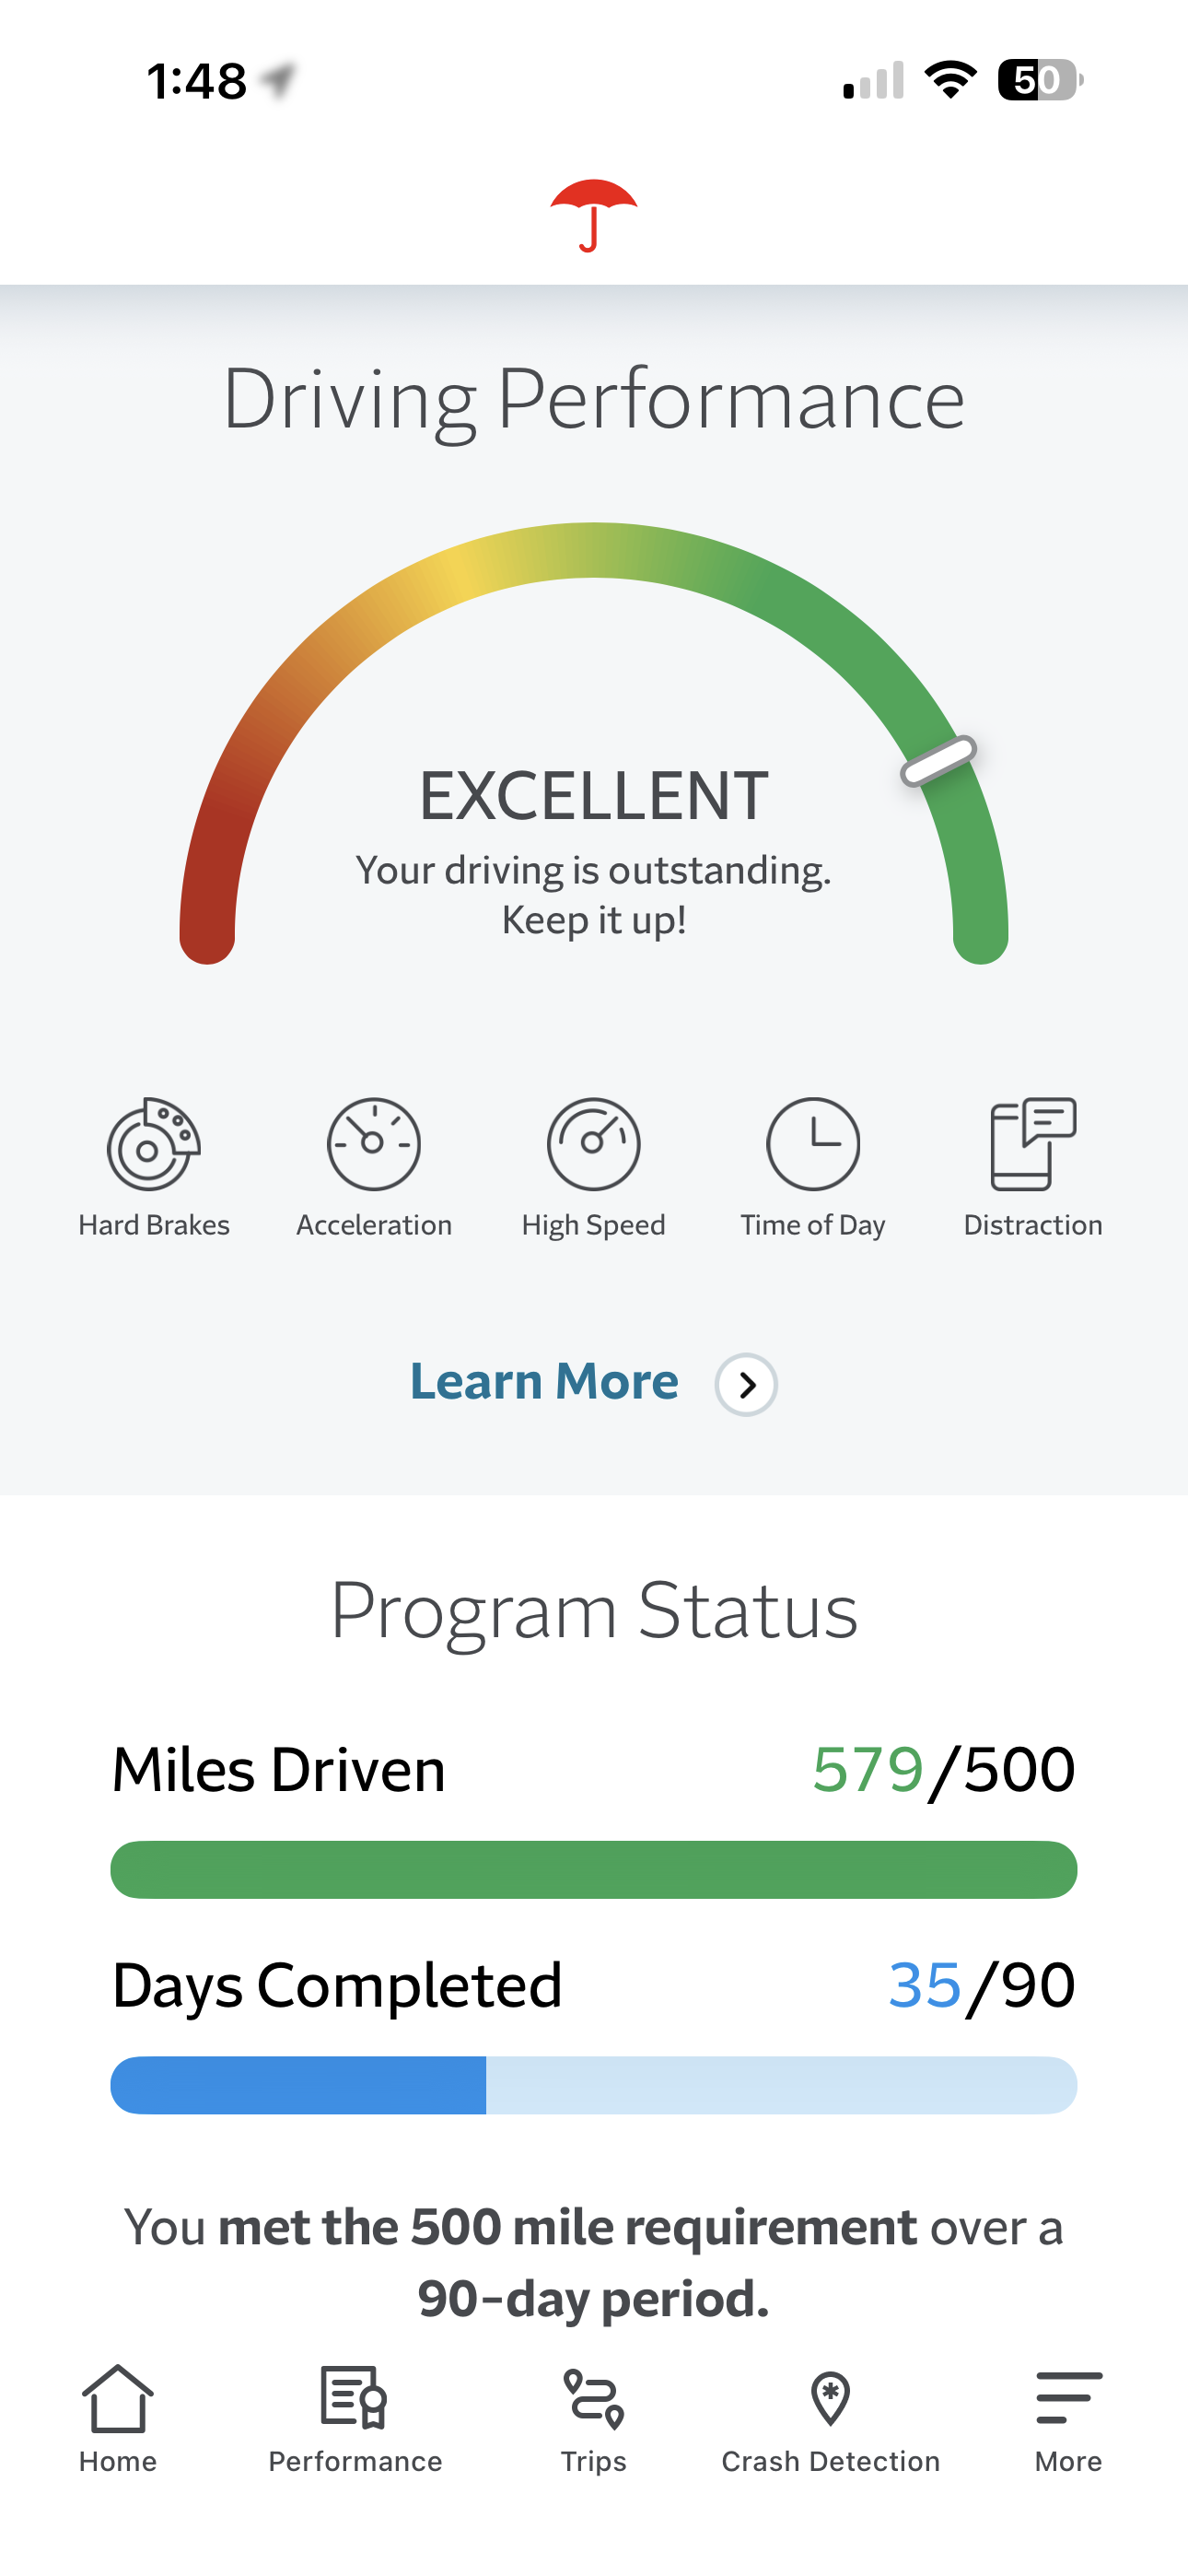
The most significant UX change was to the performance dashboard. The original rainbow spectrum gauge had two problems: it wasn’t accessible to colorblind users, and the gradient obscured rather than clarified where a customer stood. The new design replaced the color gradient with a clean monochrome arc and moved the performance rating to a clear textual label — Excellent, Good, Fair, Needs Improvement — with plain-language descriptions of what each level meant for the customer’s renewal premium. Scores were explained, not just displayed. A “Learn More About Scoring” link was surfaced prominently on the dashboard itself, not buried in an FAQ.
IntelliDrive original dashboard


Redesigned IntelliDrive 365 dashboard
Redesigned Performance Variables
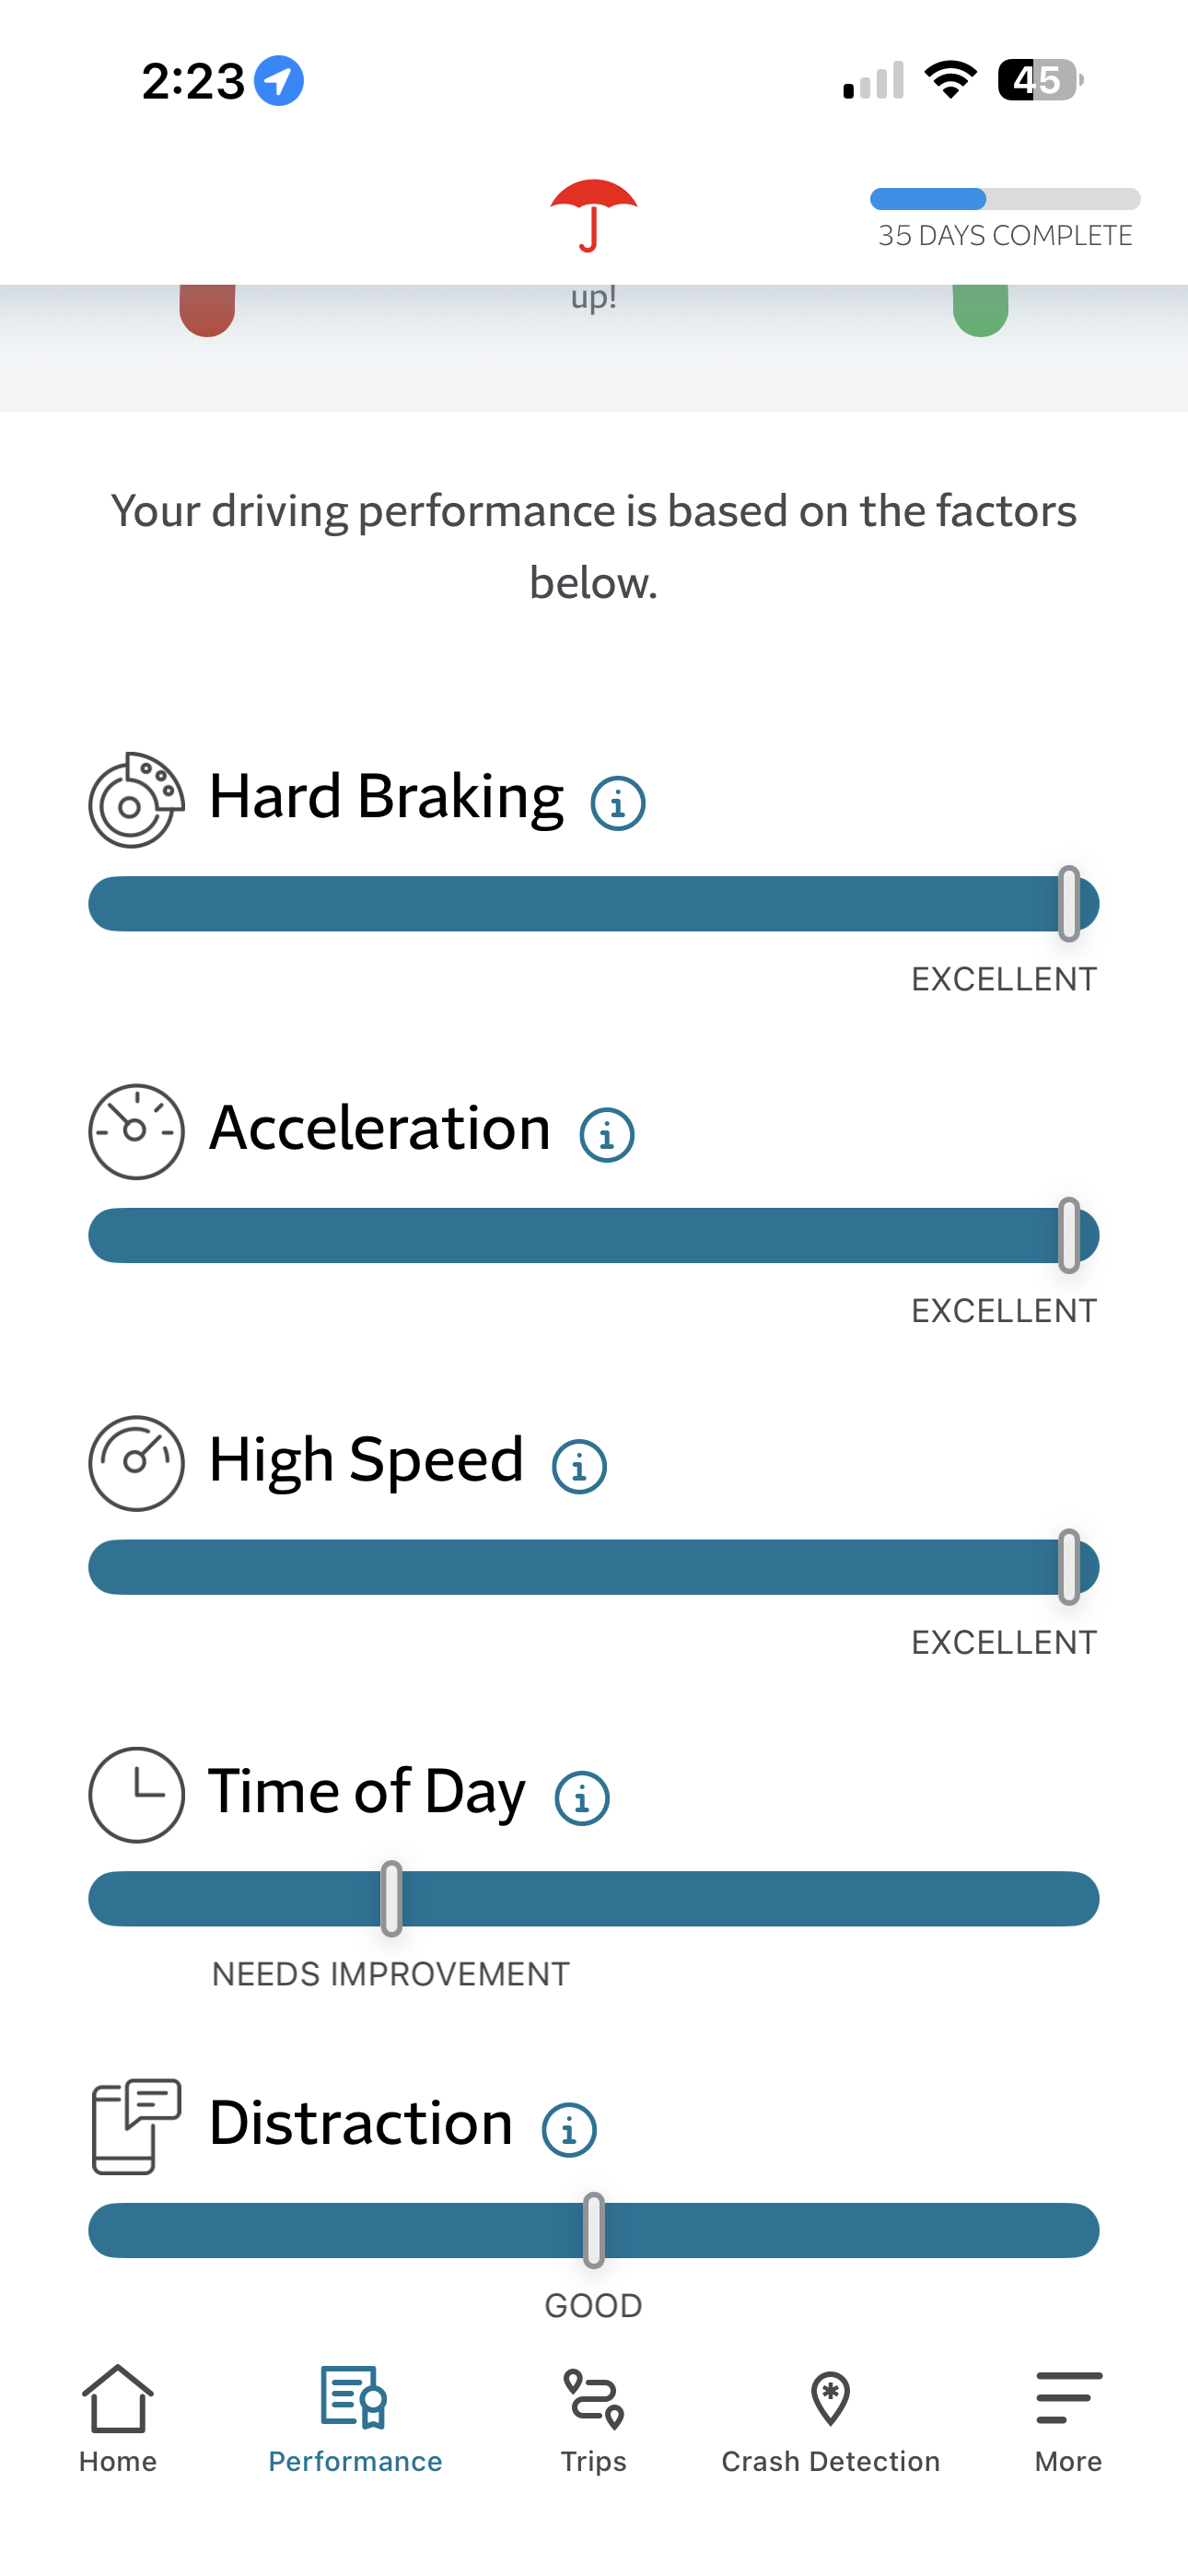
Individual scoring factors — braking, distraction, time of day, speed — were redesigned from ambiguous slider bars with a deceptively confusing indicator that implied movement into clearly labeled progress bars with categorical ratings. Icons were redrawn for legibility and distinctiveness. Each factor included an inline information icons so customers could understand exactly what was being measured and why, without leaving the screen.
IntelliDrive original variable indicators

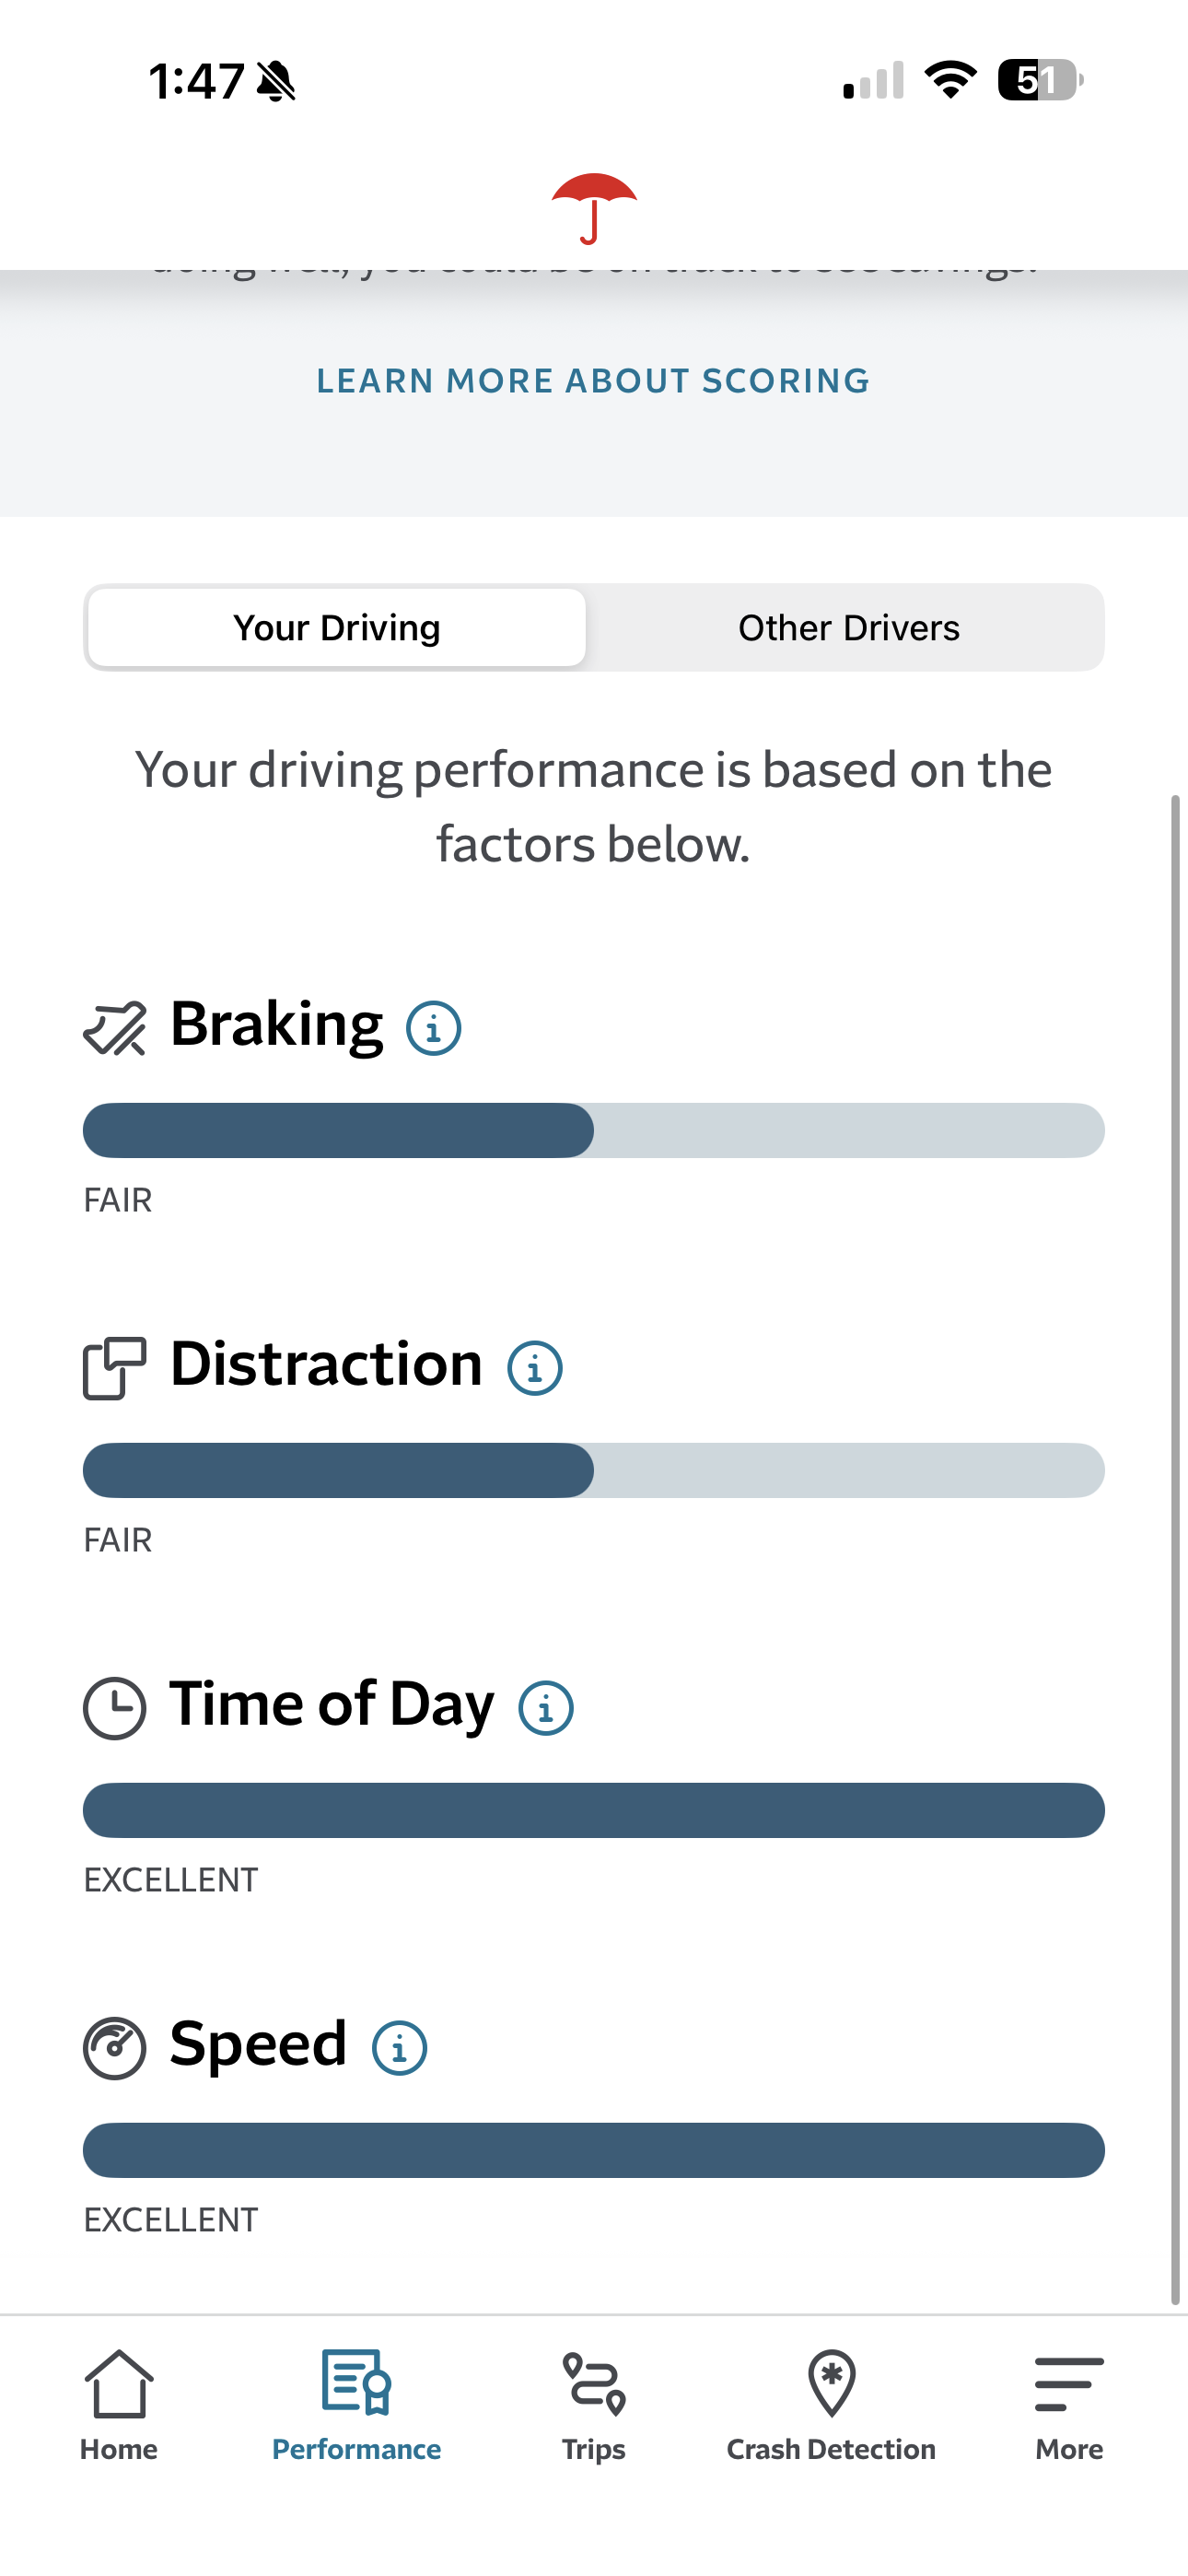
Redesigned IntelliDrive 365 bar graph indicators
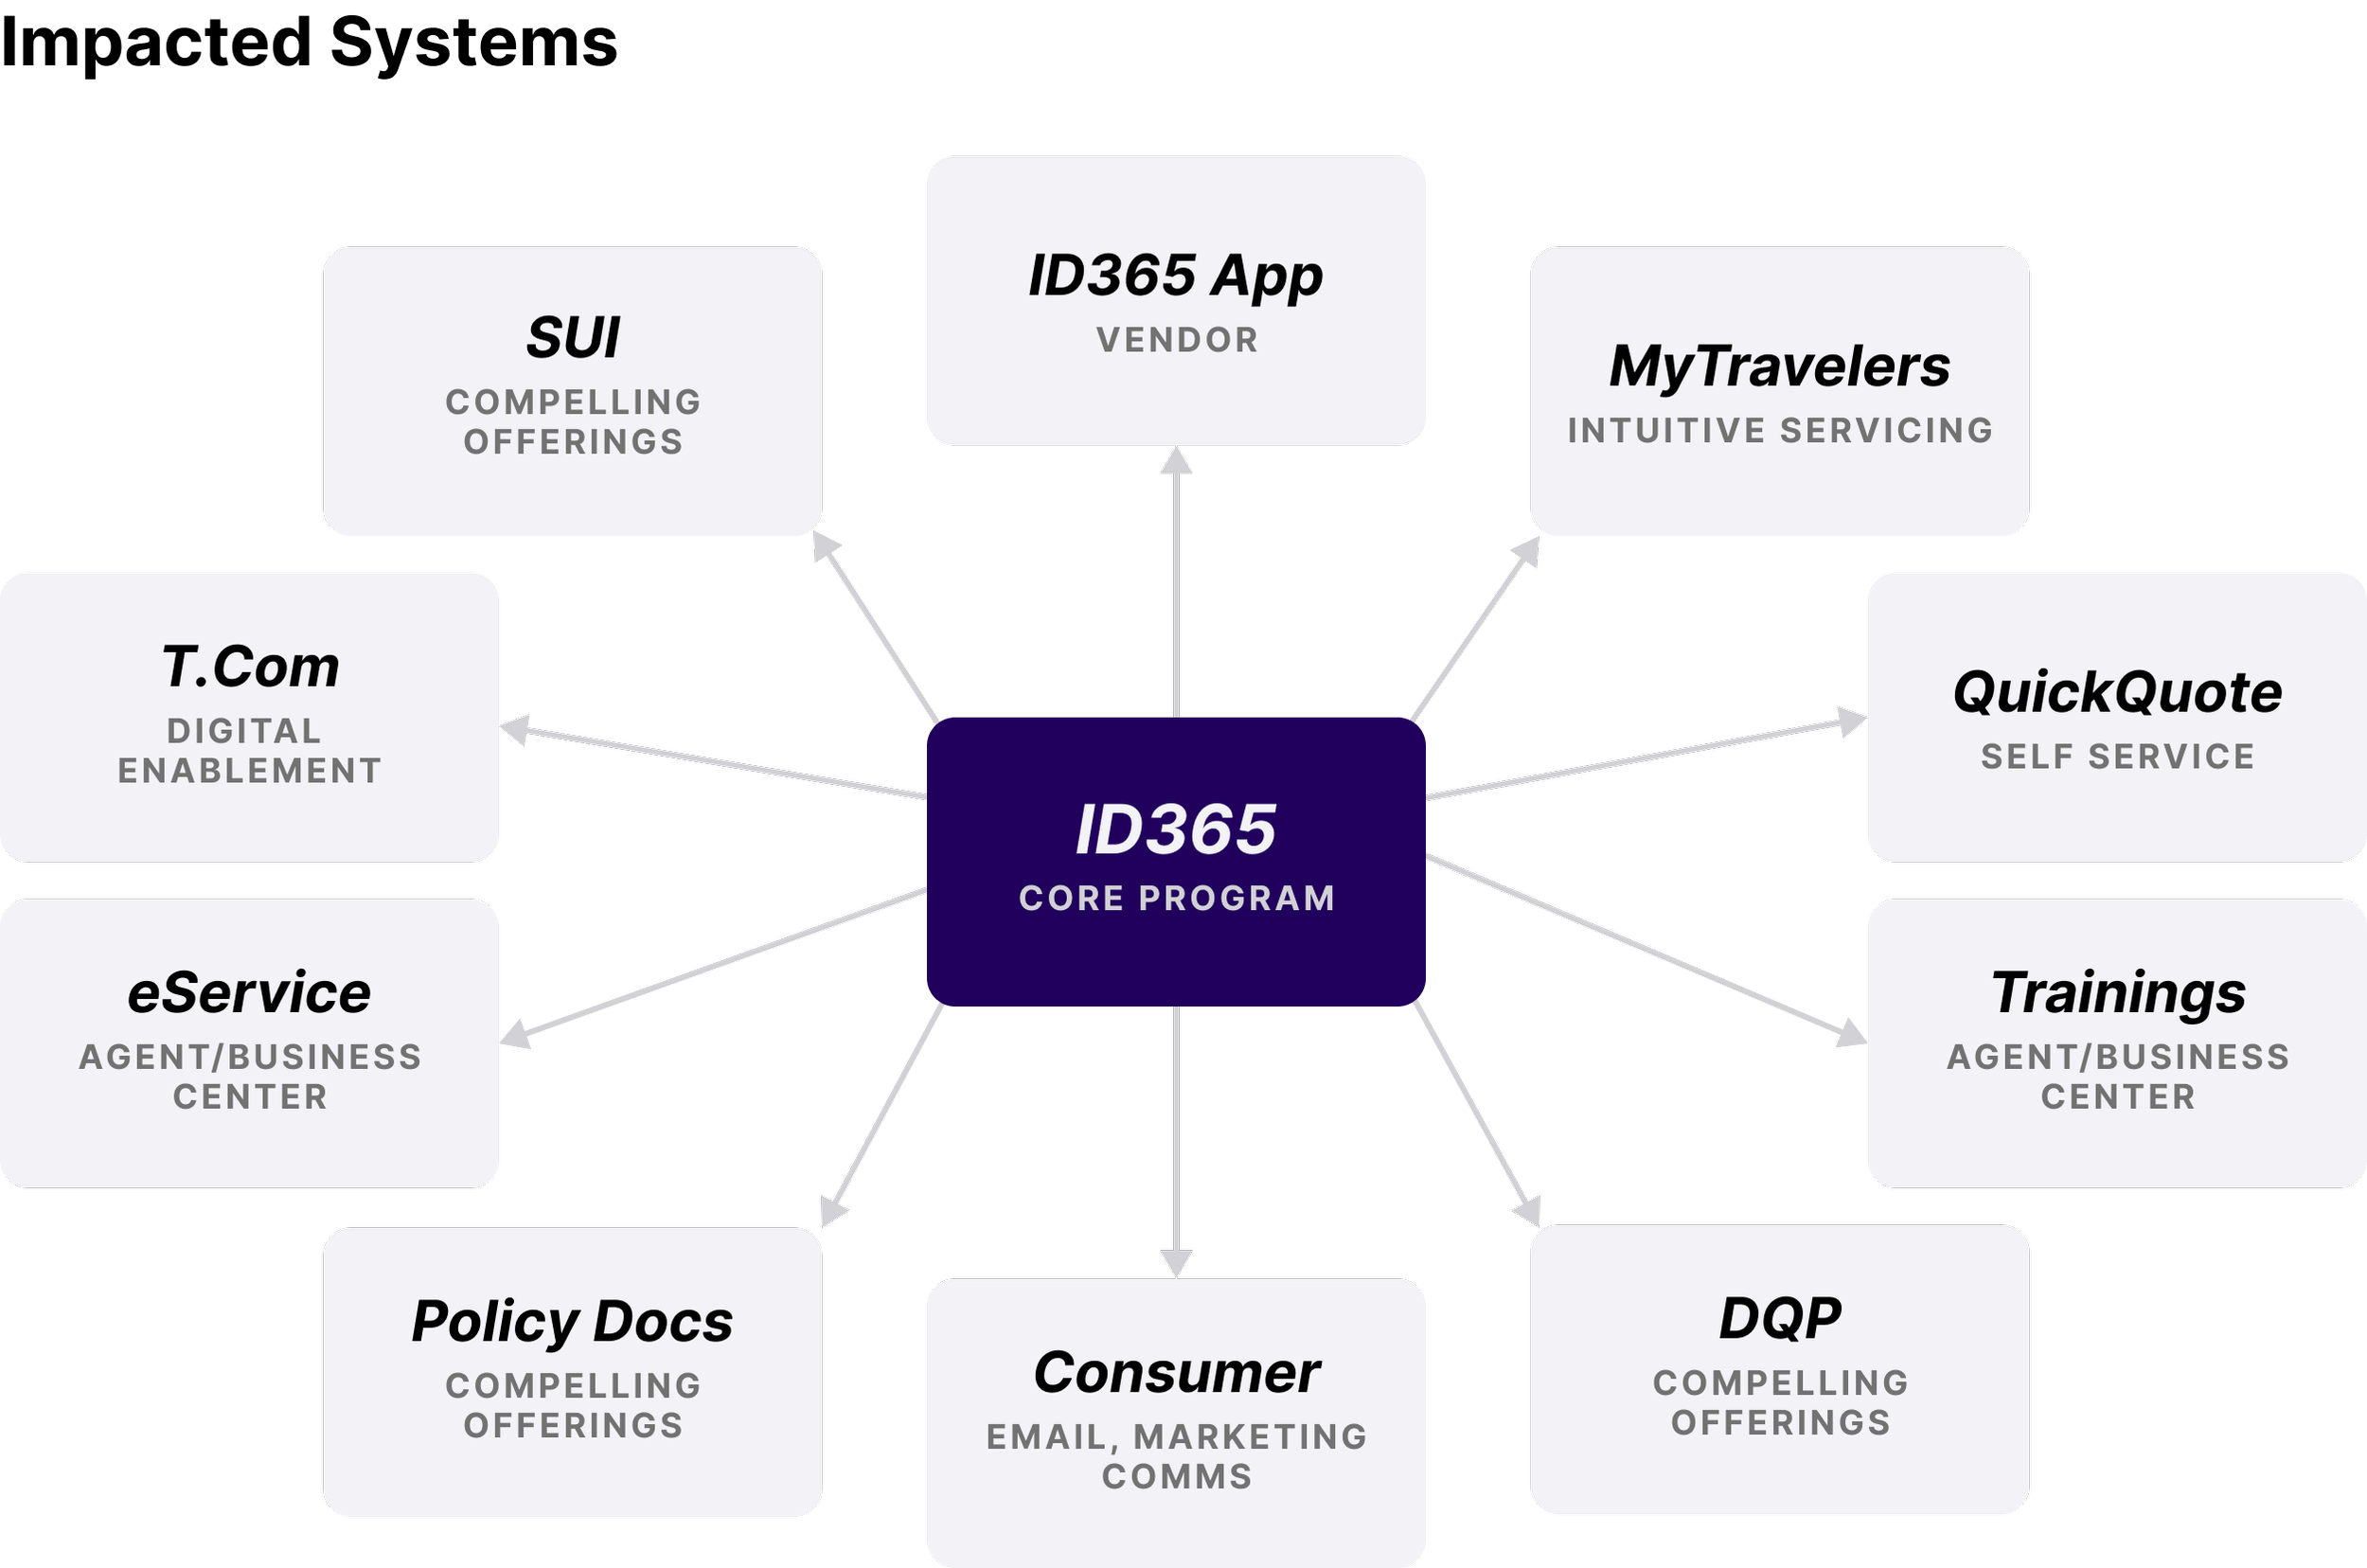
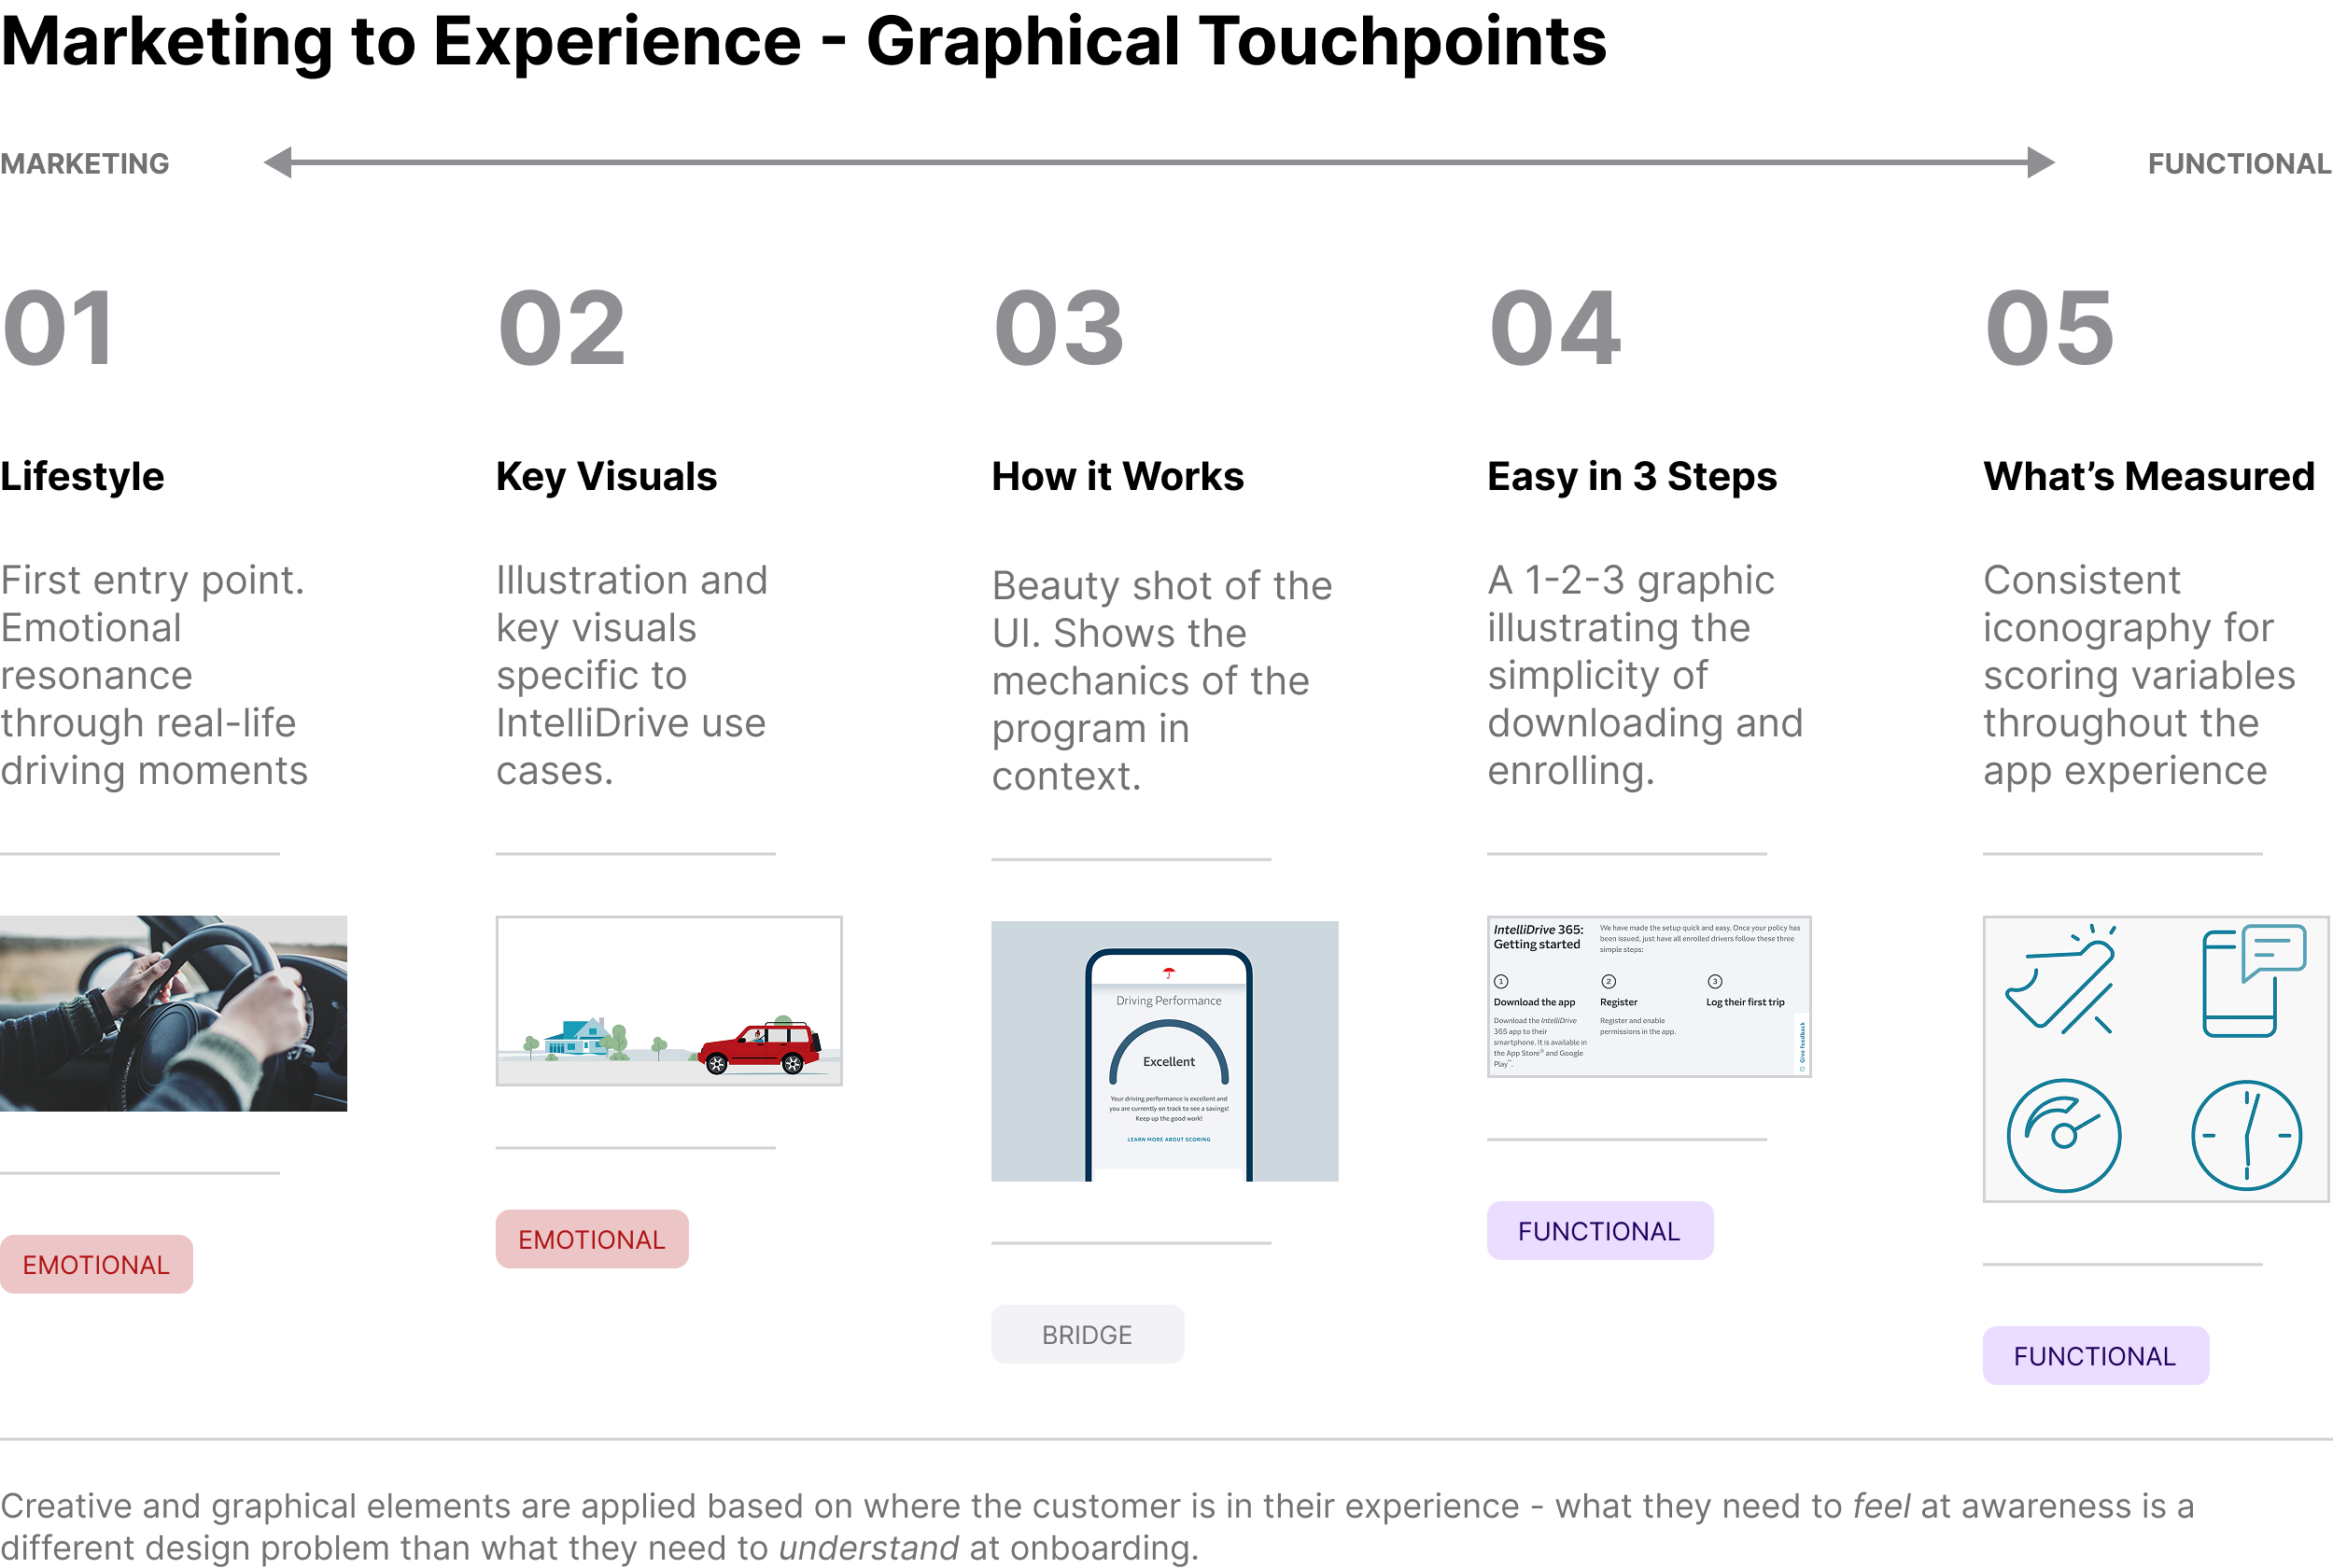
A Coherent Creative System Across Every Touchpoint
One of the more complex parts of this project wasn’t the app itself — it was the breadth of systems it touched. IntelliDrive 365 needed consistent, on-brand creative across the SUI quoting flow, T.Com, eService, QuickQuote, MyTravelers, the DQP, email communications, policy documents, agent training materials, and the app store experience. Each channel required its own creative treatment, but all of them needed to feel like the same program.
We built a Marketing-to-Experience graphical spectrum to guide those decisions. At the marketing end: lifestyle photography, key visuals, and illustration that spoke to the emotional benefit of safe driving. As you moved toward the functional end: clean UI visuals, a simple “easy in three steps” onboarding graphic, and consistent iconography for the scoring variables. The principle was that creative choices should follow the customer’s context — what they need to feel at awareness is different from what they need to understand at onboarding.
The content strategy ran on four guiding principles: Simple. Clear. Relevant. Empathetic.
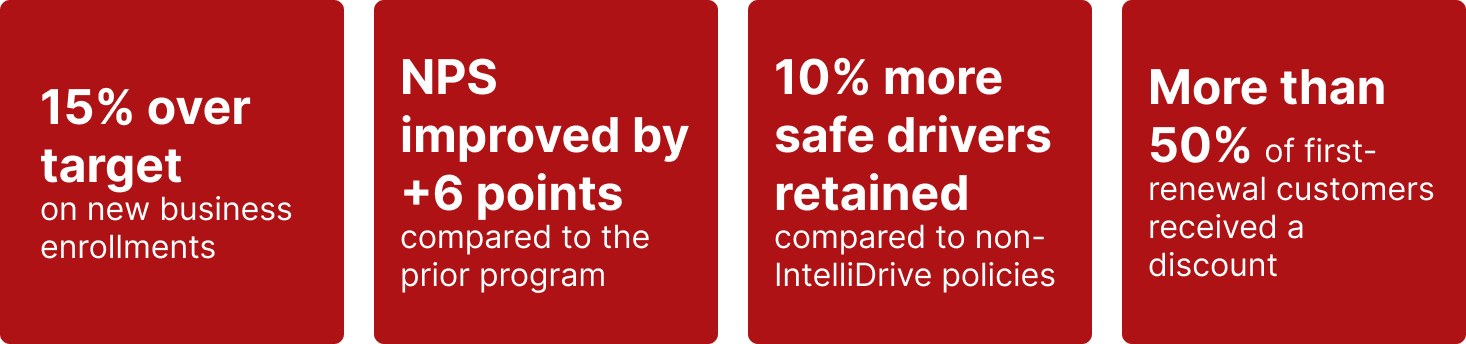
Results
The program launched as a pilot in November 2024. Early results through mid-2025:
IntelliDrive 365 was named the flagship telematics program, with the legacy IDP pilot offerings sunset in August 2025
What’s Next
The pilot informed a multi-wave national rollout currently underway. Monitoring is ongoing across five categories — new business metrics, post-issuance behavior, renewal performance, customer and agent satisfaction, and operarional impact. Average driver scores and NB loss ratio are among the metrics flagged as critical for long-term program success.
The design work continues in parallel with each wave, incorporating what we’re learning for customers in market and iterating on the experience as the program scales.
Reflection
This project was unusual in scope for a design team. The work wasn’t just “redesign the app” — it was holding design coherence across more than a dozen systems, a multi-disciplinary team, and a compressed timeline, while staying grounded in real customer pain points throughout.
The thing I’m most proud of isn’t any single screen. It’s the process of connecting VoC findings — “my score didn’t improve even though I stopped speeding” — to a specific design decision, surfacing clearer score explanations and plain-language descriptions on the dashboard, and then watching that change show up in the improved NPS. That feedback loop between listening, building, and measuring is what good experience work looks like.
Note: Performance metrics reflect early pilot data. Program results will continue to be updated as additional waves launch.